
The My Posts & Replies Widget allows users to feature a chart with the number of posts and replies created over the past seven days on processes and flow objects where the user has a level of responsibility (RASCI-VS) or/and is subscribed to.
Please follow the instructions below to customize the “My Posts & Replies” Widget.
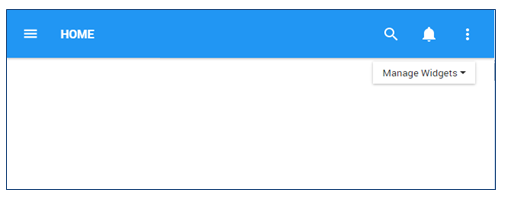
1. Upon login, you will be greeted with the following page:
2. To add widgets to your home page, navigate to the the  button and select the widget you want to add from the Dashboard Manager
3. Once the “My Posts & Replies” Widget has been added to the Home page, select the  icon at the top right corner of the Widget and select the
  button.
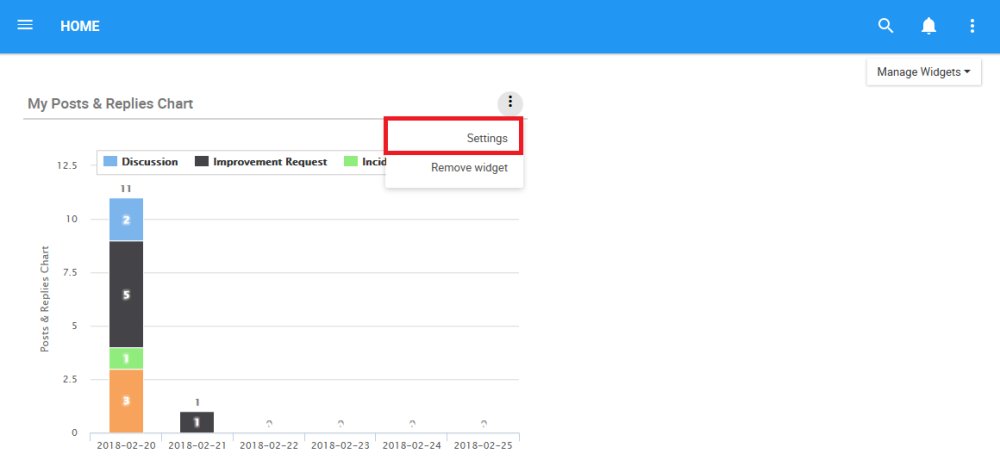
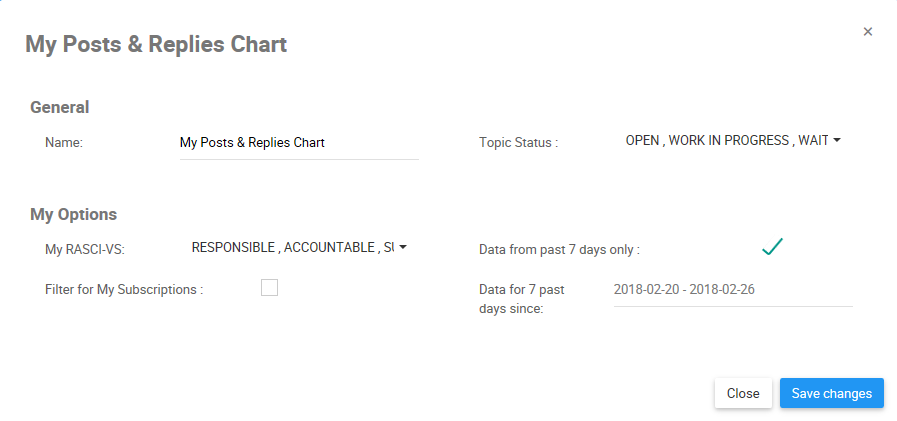
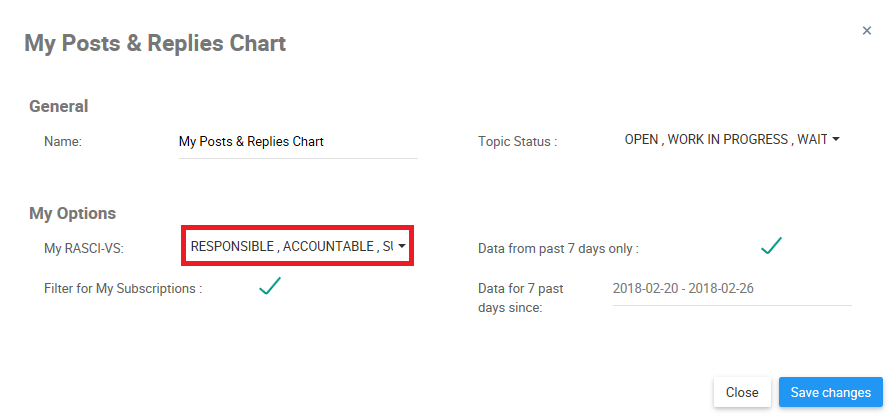
4. Click on the “Settings” button and a pop-up window will be generated as follows
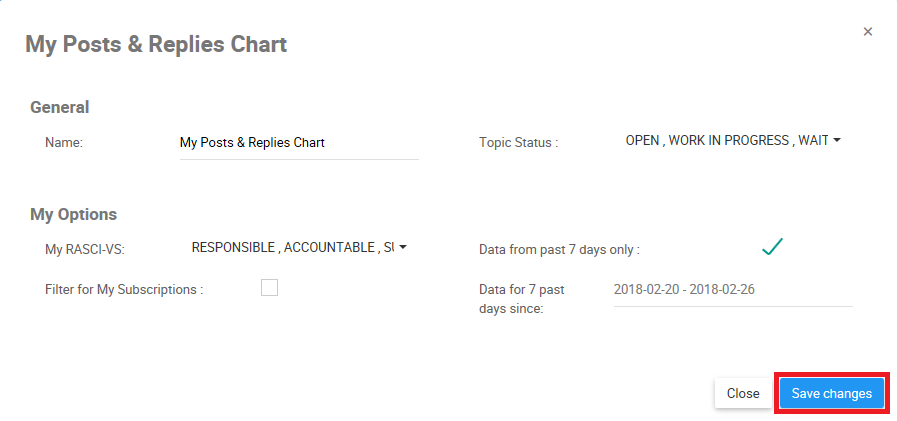
5. After customizing the settings, click on the  button to save the changes made.
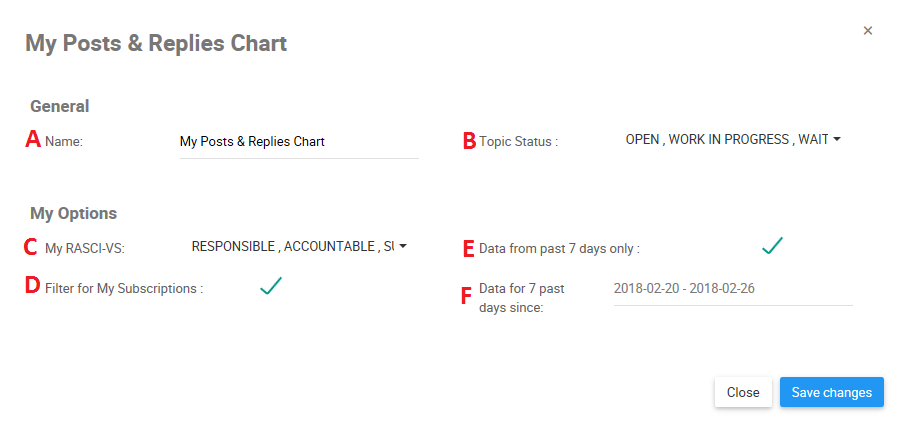
“My Posts & Replies Chart” Widget Settings Parameters
In this page there are a variety of variables that a user can set in order to customize to improve user experience.
| Item | Setting | Purpose |
|---|---|---|
| A | Name | Allows user to customize the title of the Widget |
| B | Topic Status | The current status of the new posts and replies created over the past 7 days |
| C | My RASCI-VS | Allow users to organize their Roles and Resources based on their level of involvement |
| D | Filter for My Subscriptions | Allow users to sort specific objects by subscribed items |
| E | Data from past 7 days only | Allow users to show the data from the past 7 days |
| F | Data for 7 past days since | Allow users to select a 7-day range from the calendar to be displayed on the chart |
A. Name: The “Name” Section will allow a user to customize the name of the Widget. To edit the “Name” section, please follow the instructions below
i. Navigate cursor over existing name box
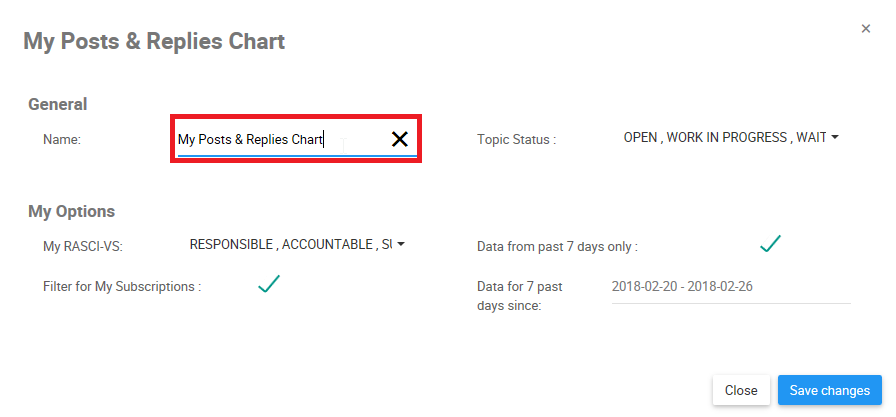
ii. Edit name by selecting name box and typing in desired name
B. Topic Status: The Topic Status filters the widget by the status of the new posts & replies created over the past 7 days. The different topic status are: Open, Work In Process, Waiting for Publish, Rejected and Closed.
i. Navigate cursor over the topic status task bar
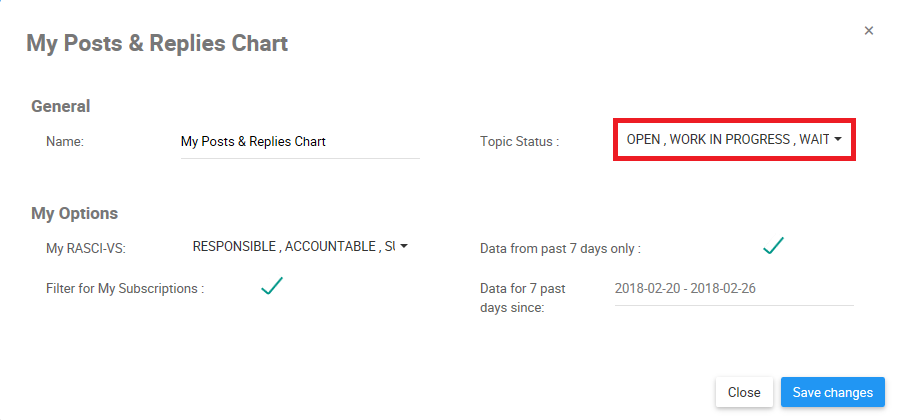
ii. Click on the task bar, which will generate a drop-down menu
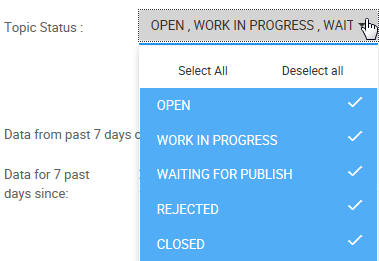
iii. Select/Deselect desired object(s) to be featured in Widget window by navigating cursor and clicking on respective objects. Additionally, the drop-down menu features  and
and  buttons that can be used for mass selection.
C. My RASCI-VS: The My RASCI-VS filter allows users to filter through their assigned roles and resources and prioritize them based on their involvement in accordance with the RASCI-VS Matrix. This filter allows users to create Widgets categorized based on their level of involvement.
R – Responsible
A – Accountable
S – Support
C – Consulted
I – Informed
V – Verified
S – Signatory
Please see My RASCI-VS section above for detailed explanation of the RASCI-VS Matrix in Section 3.4.
i. Navigate cursor to the RASCI-VS drop-down menu
ii. Click on the RASCI-VS filter and a drop-down menu will be generated
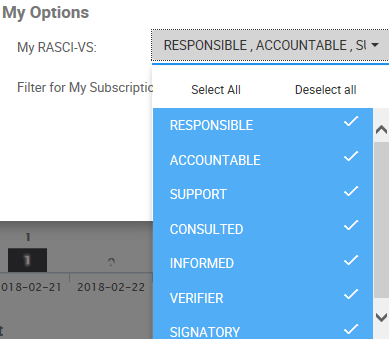
iii. Select the desired RASCI-VS Metrics. Note that you can select multiple RASCI-VS metrics.
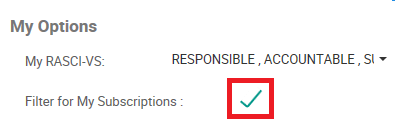
D. Filter for My Subscriptions: In order to help users prioritize information for users, a “Filter for My Subscriptions” section can be used. Users can select the “Subscriptions” option, and Widget will feature only the specific posts & replies that the user is subscribed to.
i. To “Filter for My Subscriptions,” navigate cursor over tic-box
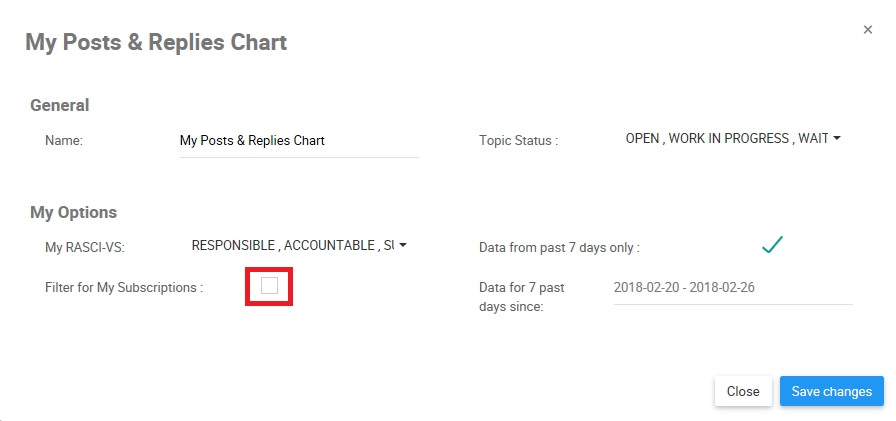
ii. Select option by clicking on box. This will generate a green check mark to confirm that option has been selected
E. Data from past 7 days only: Users can select the “Data from past 7 days only” option, and Widget will feature only the specific posts & replies that were created over the past 7 days.
i. To show “Data from past 7 days only,” navigate cursor over tic-box
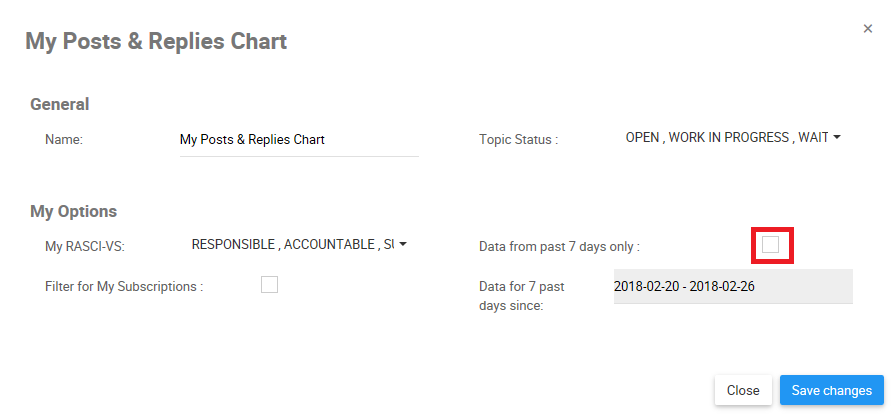
ii. Select option by clicking on box. This will generate a green check mark to confirm that option has been selected
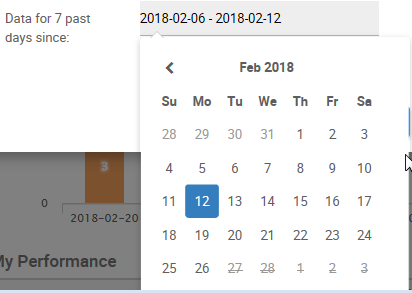
F. Data for 7 past days since: If users do not want to see the data from the past 7 days only, they need to first deselect the tic-box “Data from past 7 days only.” They can then select a 7-day range from the calendar to display the new posts and replies created during this range.
i. To show “Data for 7 past days since,” navigate cursor over the dates box
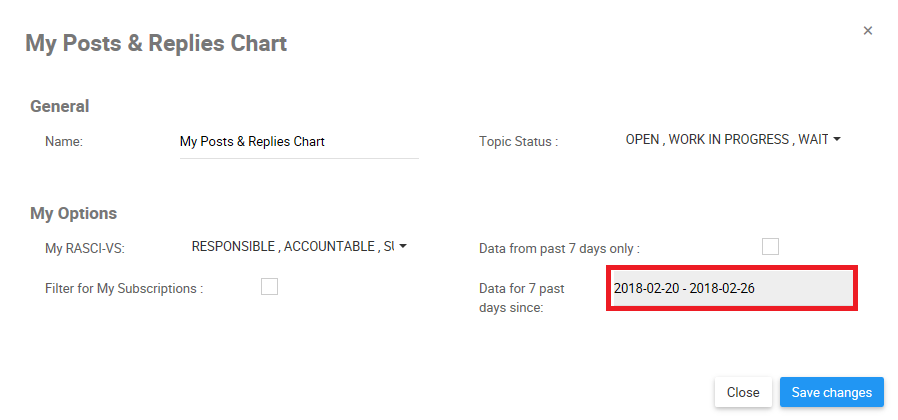
ii. A calendar will appear. Select the date you desire to see new posts and replies on the chart
Hinterlasse einen Kommentar.