
Overview Graphs allows users to view their current performance, respective to performance measures, and input data regarding their job responsibilities for superiors to view and track. This function allows users to view graphs reflecting past and current performance, allowing managers to understand and optimize the work being done.
Overview Graphs feature a variety of key information, highlighted below
| Item | Name | Description |
|---|---|---|
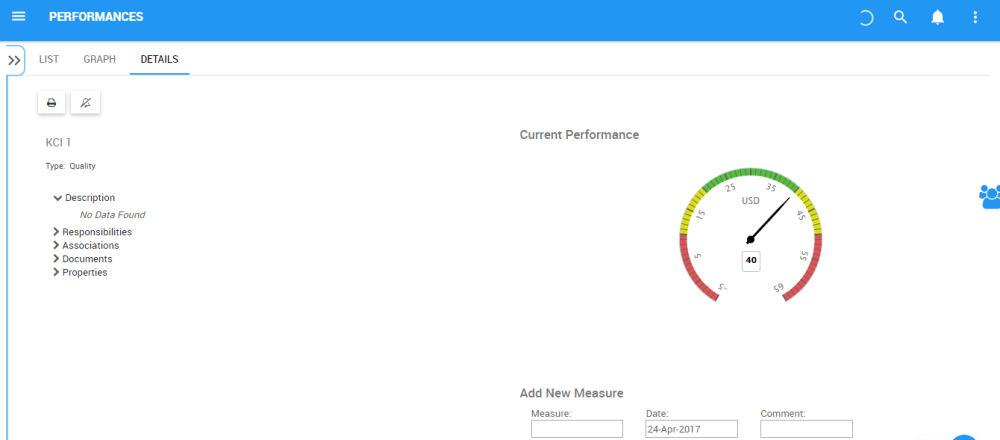
| A | Unit | Displayed the specific unit by which the performance is being measured (e.g. $$, %, Unit, etc.) |
| B1 B2 B3 |
Current Performance | The reflection of the specific, current performance on the measure. It is reflected numerically in B1 and graphically in B2. B3 identifies the performance threshold used to gauge the performance as optimal (green), acceptable (yellow) or undesirable (red) |
| C | Add New Measure | This section allows users to input measures of to evaluate performance |
| D | List of Measures | A historical list of performance measures uploaded |

The overview graphs can be viewed in 2 contexts
1. Adjacent to Impact & Hierarchy Graphs: Users can view the latest performance next to other graphs
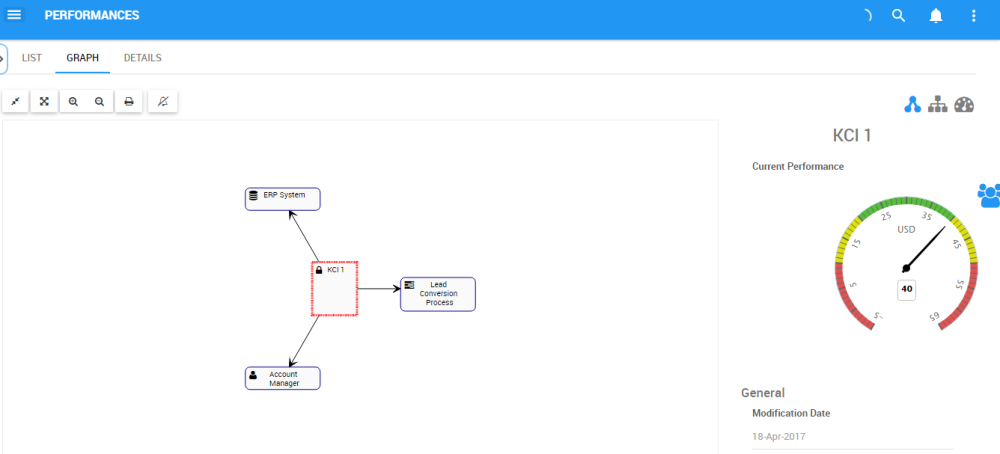
2. On the details page: Allows user to view and input performance into graphs. For further details on inputting performance measure, please see the steps below.
Hinterlasse einen Kommentar.