
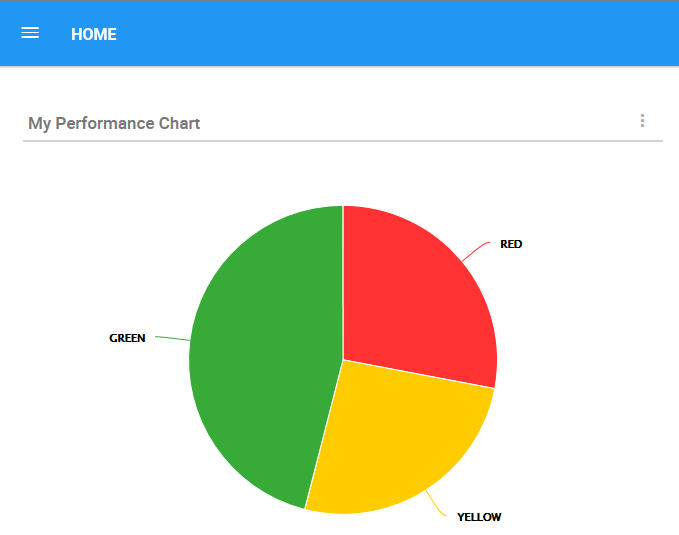
The “My Performance Chart” Widget allows users to feature the performance indicators assigned to their role with a level of responsibility in a pie-chart. Each portion counts of all Key Performance Indicators (KPIs), Key Control Indicators (KCIs) and Key Risk Indicators (KRIs) where the user’s role has a level of responsibility assigned to the performance measure.
The pie-chart is divided by color in three portions. The Pie portion in the color Green represents the indicators that their performance is above expectations, the Pie portion in the color Yellow represents the indicators that their performance is acceptable, and the Pie portion in the color Red represents the indicators that their performance is below expectations.
This Widget allows users to visually monitor and view the performance of the indicators assigned to their role on their Home Page. To read more about the Performance Module, click here.
My Performance Chart Widget Navigation
1. Navigate to the Home Page and add a “My Performance Chart” Widget using the Dashboard Manager
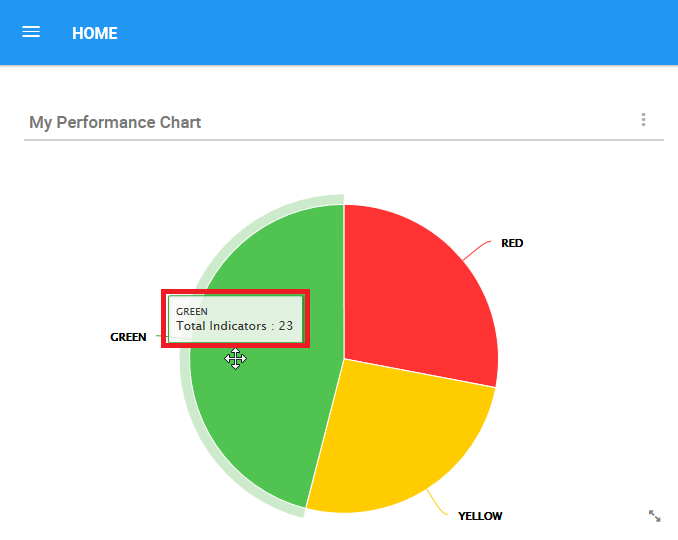
2. To view the total number of indicators for each portion, the user needs to hover with his mouse over the portion on the pie-chart to see the numerical value. For this example, hover over the Green portion to see the number of indicators performing above expectations.

3. The numerical value of the total indicators performing above expectations will appear in a box.
To customize the My Performance Chart Widget, click here
Post your comment on this topic.