
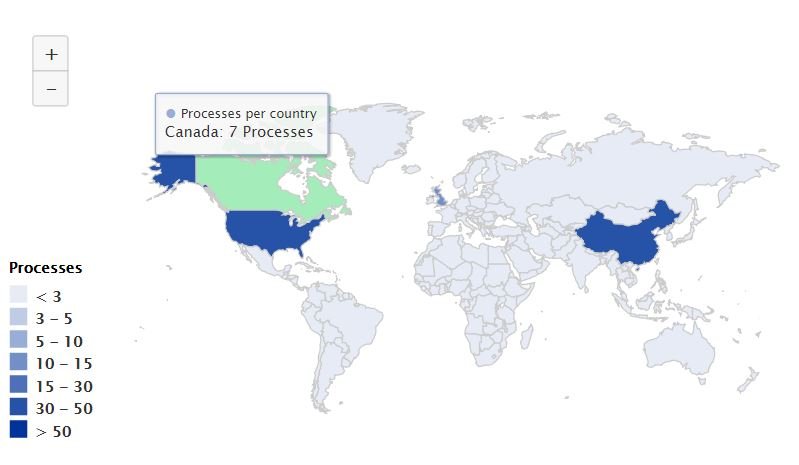
The map widget shows how many localized processes there are per country on a world map. It allows companies to quickly determine per country basis where their most concentrated amount of localized processes are.
Map Widget Features
The map is color coded to show where the highest concentration of localized processes are located.
To zoom in or out of the map, use the “+” or “-” buttons.

Hovering the mouse over the country will show how many localized processes exist for that country
The widget can also be printed in various formats

- Print chart: Prints the map widget
- Download PNG Image: Downloads a picture of the map widget in a PNG format directly on your computer
- Download JPEG Image: Downloads a picture of the map widget in a JPEG format directly on your computer
- Download PDF Document: Downloads the map widget in a PDF Document format directly on your computer
- Download SVG Vector Image: Downloads a picture of the map widget in a SVG format directly on your computer
To customize My Map Widget, click here.
Laissez votre avis sur ce sujet.