
Hierarchy Graphs allows users to view the vertical and horizontal hierarchy of Objectives and Performance Measures. This view provides users with a graphical representation of where specific Performance Measures fit within the overall organization.
Hierarchy Graphs show users to see all business Objectives, KPIs, KCIS and KRIs, as well as where they fit within an organization. This allows organizational users to understand organizational activities and gauge complexity of business performance.
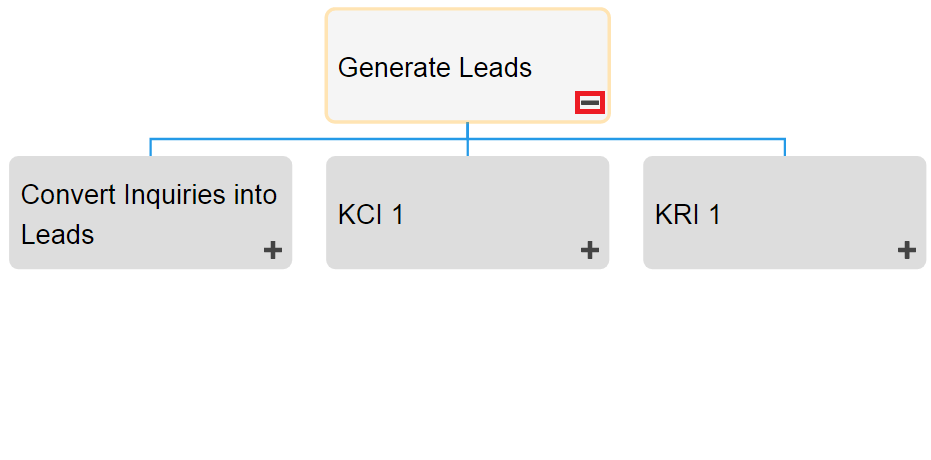
Users can expand and close item sets easily, allowing users to view a high-level organization structure, and expand sections they wish to gain further information on.
Hierarchy Graph Navigation
To navigate to Hierarchy Graphs, please see the following instructions.
1. Navigate to Performance
2. Select the item to which you would like to view.
3. Select the “Quick Graph View” icon  of the desired item
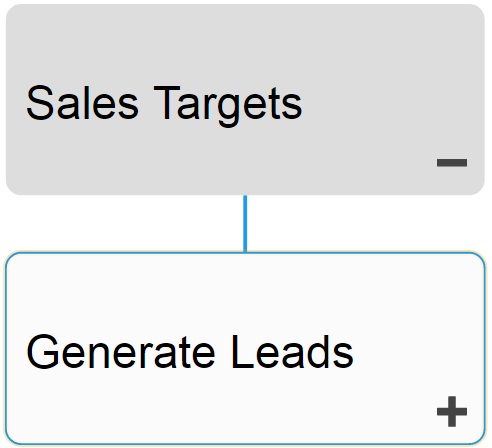
4. You will be navigated to the “Objectives” Hierarchy Graph. The entire set will not be fully displayed upon initial navigation and will display the individual item selected.
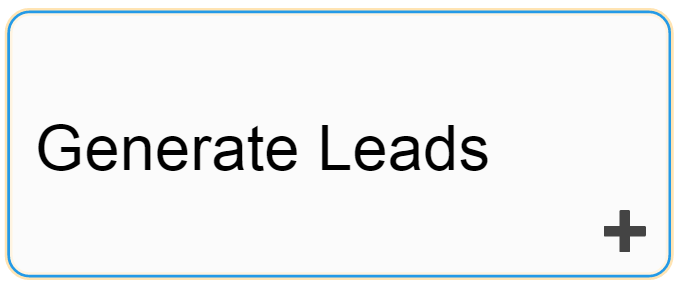
5. To further expand components of the Hierarchy Graph, double click on the  on the objects in the Graph. This will expand the item selected.
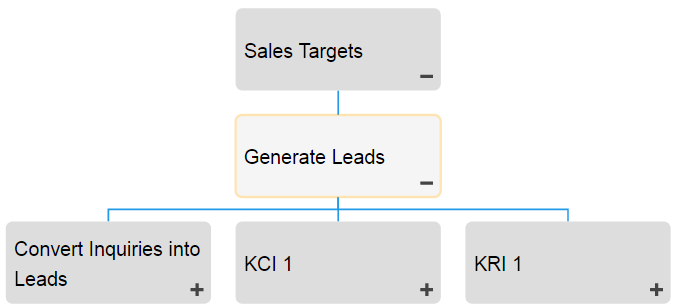
6. Repeat step 5 until you reach the desired depth.
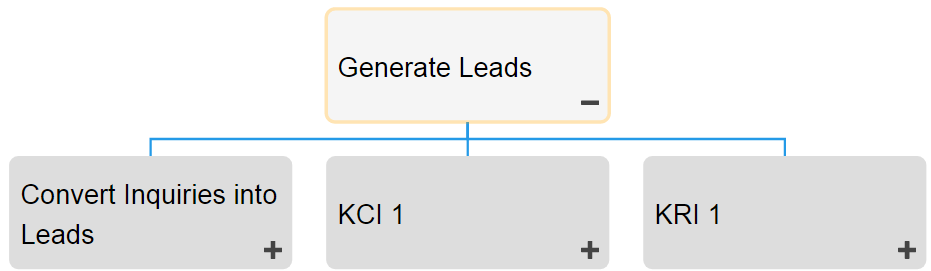
7. To close opened items, double-click on the  icon
icon
Post your comment on this topic.