
When analyzing a process, the integrated process simulator allows users to simulate a realistic scenario of execution of the process, helps identify the bottleneck, and determine true operational cost.
The simulator also allows the user to generate intelligent reports, based on their process details, as well as a variable which they control.
- User can analyze their process quantitatively;
- User can develop insights for improvement or risk;
- User can test the hypothesis by editing the simulation scenario;
- User can re-analyze the results to find an optimum solution.
To generate a simulation you must first be on a process that already has a graph.
1. Navigate to a process. In the details or graph view, click on Tools dropdown menu __ located on the toolbar.
2. Select Simulation
3. The simulation screen will appear and the user will be prompted to create a simulation scenario including the following data:
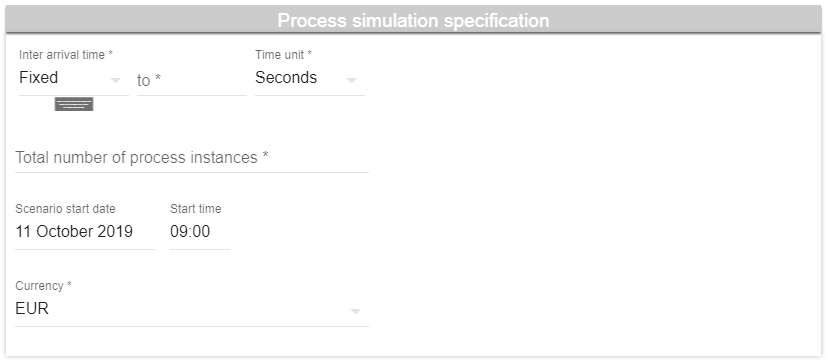
Process simulation specification
- Internal Arrival Time: At what interval do these processes occur?
- Total number of process instances: how many instances of this business process typically take place?
- Scenario start date and start time: When do these instances start?
- Currency: which currency is used to calculate the cost?
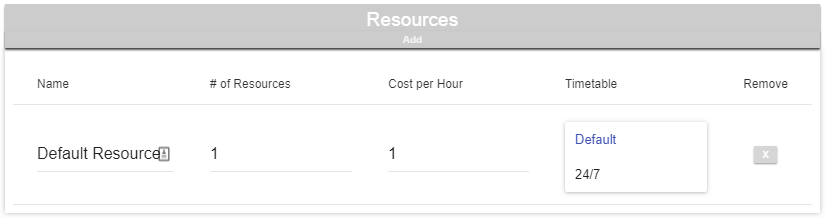
Resources
This features the roles assigned to the user’s flow shape
- Name: identified by role
- Number of resources: how many of these roles are required? N.B: this is a required field
- Cost per hour: hourly cost to resources
- Timetable: applicable timetable
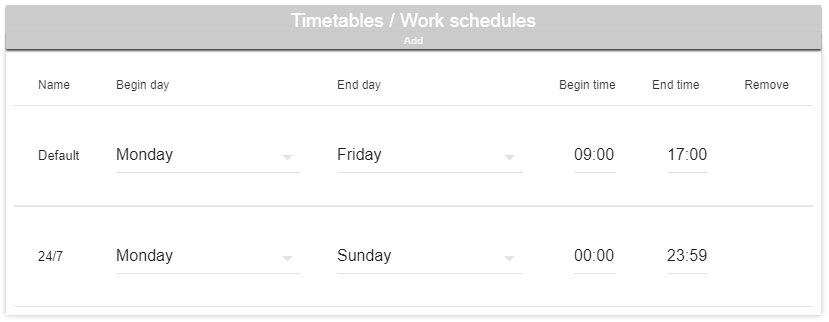
Timetables/Work Schedules
- This defines the work schedule for the roles
- Default timetable used for creation of process instances
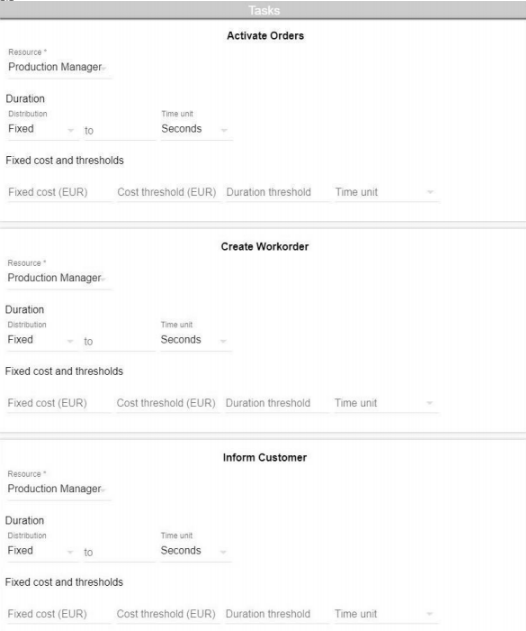
Tasks
The tasks are separated and are shows in sequential order. In this example we are using “Activate Orders”, “Create Workorder”, and “Inform Customer”.This defines the duration, fixed cost, and any cost threshold which may apply to individual tasks.
- Resource: identified by role; e.g, Production Manager
- Duration and fixed cost: of each task and event; it supports uniform, normal, exponential, triangular, gamma, log-normal and complex combined distribution for the duration.
- Thresholds: for cost and duration of each task
- Time unit: select seconds, minutes, hours or days from dropdown filed
- Resource: * Note that the resources are dynamically loaded from roles assigned to your activities
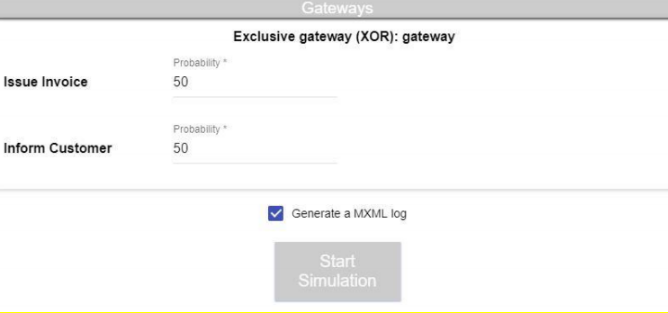
Gateways
Use to define the probability of occurrence for the decision in your process
- Branch probabilities for each a conditional branch in your model, in this example, view the two listed gateways: Issue Invoice and Inform Customer
- Generate an MXML log
- Click the start simulation button to simulate the process and analyse the result
Once the user clicks on the start simulation button, they can review a report which includes the following:
- Resource utilization: see average utilization percentage of each resource in the simulation scenario
- Cycle times (process duration): the simulator will output the total cycle time of the scenario
- Individual task/element statistics about cost, duration, waiting time and thresholds
- Visual heat-maps of the business process model based on waiting times, counts, costs and duration
Post your comment on this topic.